Real Sample Result
Loan balance
$100,000
Annual interest rate
15.00%
1.25% monthly
Current payment
$1,264/mo
Current path term
30y 3mo
Jane Mortgage Example
See how Fynia compares payoff paths for a sample mortgage and highlights the payment path with the strongest Payment Efficiency.
This is a sample scenario. Results are estimates based on the loan inputs shown and lender terms.
Before vs Ideal
Jane's current path versus the strongest efficiency path
Fynia compares Jane's current payment against the six payoff paths in the report. In this sample, Ideal creates the strongest balance between extra monthly cash, projected savings, and payoff speed.
For +17.3% more each month:
66.2% less interest
59.0% shorter payoff
Jane's Ideal path is not the highest payment. It is the option with the strongest balance between extra monthly cash, projected savings, and payoff speed in this sample.
Six payoff paths
All six paths included in the same sample report
Each path represents a different monthly budget and tradeoff. The goal is not always to pay the most. The goal is to compare which path makes the strongest use of each extra monthly dollar.
Basic
Lightest step upFor +3.9% more each month
38.3% less interest
32.5% shorter payoff
Payment increase vs. interest reduction
For +3.9% more each month, projected interest falls 38.3%.
That is 34.4 percentage points more interest reduction than payment increase.
A cautious step up for borrowers who want improved results with the smallest monthly increase.
9y 10mo faster payoff. Useful starting point, but still materially below Ideal on Payment Efficiency in this sample.
Standard
Balanced middle pathFor +5.5% more each month
44.7% less interest
38.3% shorter payoff
Payment increase vs. interest reduction
For +5.5% more each month, projected interest falls 44.7%.
That is 39.3 percentage points more interest reduction than payment increase.
A steady middle path for borrowers who can contribute a bit more without moving too aggressively.
11y 7mo faster payoff. A practical middle ground when you want a modest payment bump with much larger projected benefits.
Premium
Stronger progressFor +8.1% more each month
52.2% less interest
45.2% shorter payoff
Payment increase vs. interest reduction
For +8.1% more each month, projected interest falls 52.2%.
That is 44.1 percentage points more interest reduction than payment increase.
A stronger progress option that unlocks bigger savings without jumping into the most aggressive range.
13y 8mo faster payoff. Close to the strongest efficiency range while still requiring a controlled monthly increase.
Ideal
Peak efficiencyFor +17.3% more each month
66.2% less interest
59.0% shorter payoff
Payment increase vs. interest reduction
For +17.3% more each month, projected interest falls 66.2%.
That is 48.9 percentage points more interest reduction than payment increase.
The option where extra monthly cash, projected savings, and payoff speed create the strongest balance.
17y 10mo faster payoff. Ideal marks the strongest Payment Efficiency balance in this sample, not the highest payment.
Quick
Faster payoff focusFor +32.2% more each month
76.1% less interest
69.4% shorter payoff
Payment increase vs. interest reduction
For +32.2% more each month, projected interest falls 76.1%.
That is 43.9 percentage points more interest reduction than payment increase.
A faster-payoff path for borrowers who can commit meaningfully more monthly cash.
21y 0mo faster payoff. It moves faster, but the bigger payment already produces weaker efficiency than Ideal.
Max
Comparison capFor +86.2% more each month
87.9% less interest
83.2% shorter payoff
Payment increase vs. interest reduction
For +86.2% more each month, projected interest falls 87.9%.
That is only 1.7 percentage points more interest reduction than payment increase.
Max shows the upper end of the tested range. It may save more total dollars, but it is not necessarily the most efficient recommendation.
25y 2mo faster payoff. The results improve, but the payment jump is so large that this becomes a comparison cap, not the smartest default move.
Payment Efficiency
Why Ideal beats Max on efficiency in this sample
Payment Efficiency compares how effectively each extra monthly dollar turns into projected savings and faster payoff.
- Ideal is the strongest efficiency balance in this sample - not the highest payment.
- Max marks where larger payments may create weaker returns, not the default recommendation.
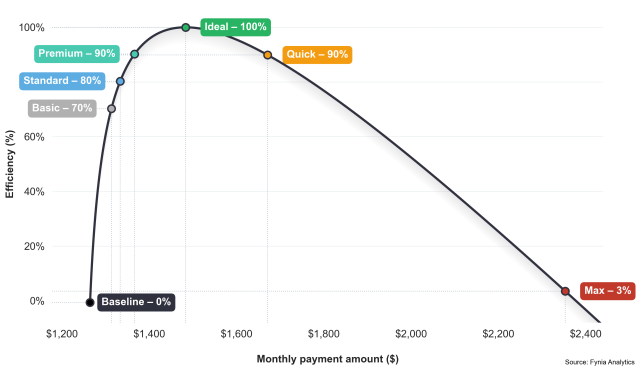
Compare every path side by side
This is the deeper comparison layer for users who want the full picture. Review affordability, projected savings, payoff speed, and Payment Efficiency in one place.
| Metric | Baseline | Basic | Standard | Premium | Ideal | Quick | Max |
|---|---|---|---|---|---|---|---|
| Monthly payment | $1,264/mo | $1,313/mo+$49 · 3.9% increase | $1,333/mo+$69 · 5.5% increase | $1,366/mo+$102 · 8.1% increase | $1,483/mo+$219 · 17.3% increase | $1,671/mo+$407 · 32.2% increase | $2,353/mo+$1,089 · 86.2% increase |
| Projected interest | $358,183 | $220,991$137,192 savings · 38.3% less | $197,918$160,265 savings · 44.7% less | $171,173$187,010 savings · 52.2% less | $120,947$237,237 savings · 66.2% less | $85,434$272,750 savings · 76.1% less | $43,511$314,672 savings · 87.9% less |
| Payoff term | 30y 3mo | 20y 5mo9y 10mo faster · 32.5% shorter | 18y 8mo11y 7mo faster · 38.3% shorter | 16y 7mo13y 8mo faster · 45.2% shorter | 12y 5mo17y 10mo faster · 59.0% shorter | 9y 3mo21y 0mo faster · 69.4% shorter | 5y 1mo25y 2mo faster · 83.2% shorter |
| Total repayment | $458,183 | $320,991 | $297,918 | $271,173 | $220,947 | $185,434 | $143,511 |
| Payment Efficiency | 0.0% | 70.4%34.4pp efficiency ratio | 80.3%39.3pp efficiency ratio | 90.3%44.1pp efficiency ratio | 100.0%48.9pp efficiency ratio | 89.9%43.9pp efficiency ratio | 3.5%1.7pp efficiency ratio |
Download Jane's sample PDF report
The PDF shows the full sample report with payoff paths, projected results, and amortization schedules.
Find the payoff path that fits your numbers.
Run your loan analysis, compare all six payoff paths, and download your personalized payoff report.
One-time report. No subscription. Results are estimates based on your inputs.